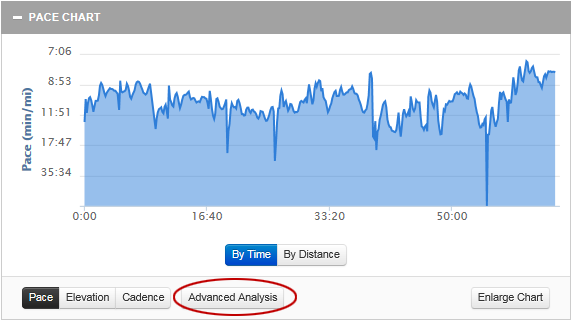
We have recently made some updates to our Advanced Analysis view of workout data. To access the Advanced Analysis page, click the “Advanced Analysis” button from the charts box on the workout details screen.

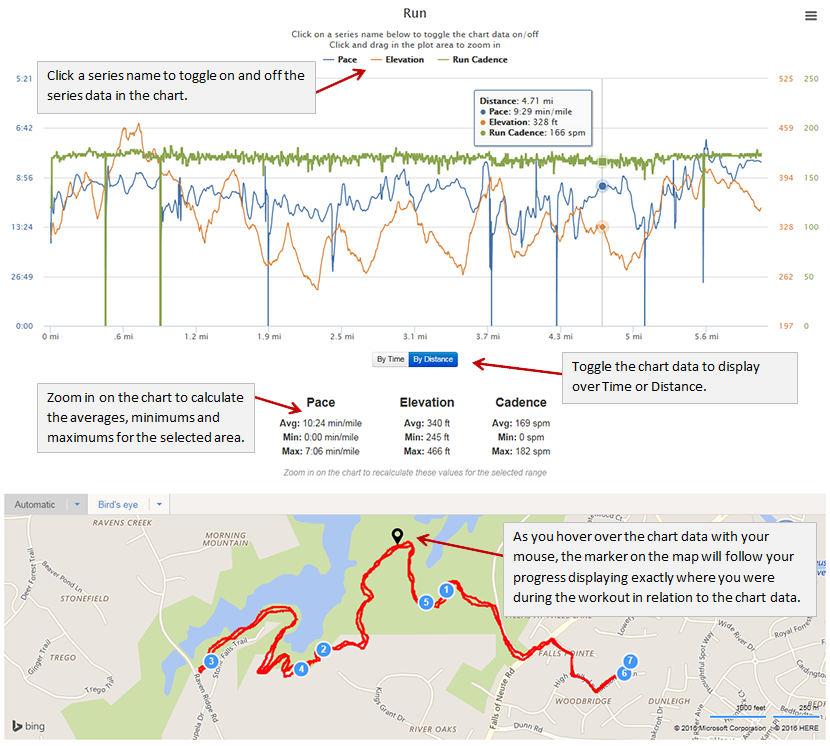
Once you have clicked the “Advanced Analysis” button, you will be taken to our Advanced Analysis workout page. This page now has additional functionality that will better help you and your coach analyze specific segments of your workout and drill down into the data.
First, we now display the average, minimum and maximum values for each data series underneath the chart. If you zoom in on a segment of the chart, this data series will be recalculated showing values for the specific segment you have zoomed in on.
Secondly, we have added the ability to chart the data by both Time and Distance. Simply click the “By Time” or “By Distance” button underneath the chart to toggle the x-axis data.
Finally, we have added the workout map (if GPS data exists for the workout). This map will display all of the splits you took during your workout. Additionally, we now have a marker on the map that will show you the exact location you were at during the portion of the workout you hover over in the chart above. As you move through the data series in the chart with your mouse, the marker on the map will move with you.

We have additional updates to our Advanced Workout Analysis coming in the near future as well. Please continue to check our blog for the latest feature updates!
Team Final Surge


