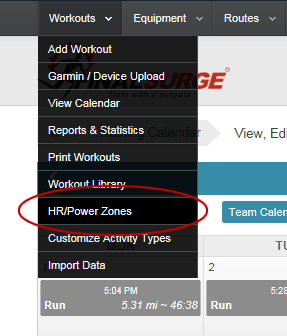
If you utilize a heart rate monitor or power meter while you are training and have set up heart rate and/or power zones in Final Surge, you will now have access to new reports and charts detailing the amount of time you spend in each zone. First, if you have not ever set up heart rate or power zones, you can do so by going to the main navigation at the top of the log and clicking “HR/Power Zones” under the “Workouts” dropdown menu. This will take you to our zone setup page and allow you to create custom zones for each different activity type.
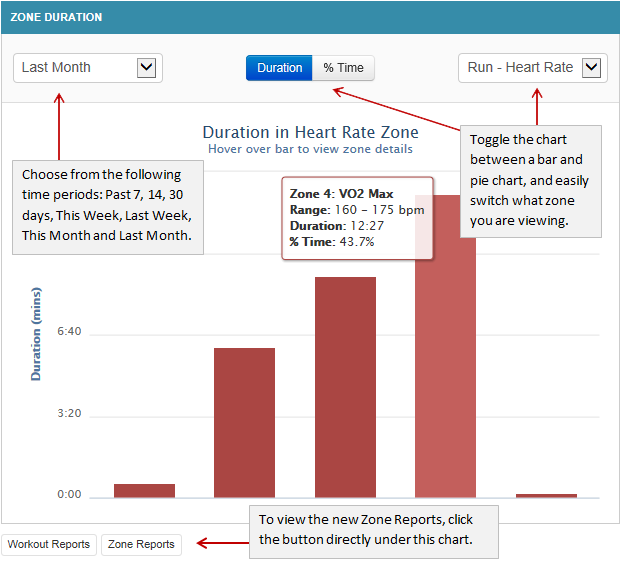
Once you have set up heart rate or power zones in Final Surge and have begun uploading workout data to the zones you have set up, you will now be able to utilize the new charts and reporting functionality in the system. The first new chart you will notice is on our Dashboard page. In addition to the Training Volume chart on the Dashboard, you will now see a Zone Duration chart (as long as you have at least one zone set up in the system). This chart will allow you to see a snapshot of how much time you have spent in each zone. YouÍll be able to toggle the time period of the chart using the dropdown menu at the top, in addition to changing the chart between a bar and pie chart by clicking the “Duration” and “% Time” buttons. Finally, you can swap what zones you are looking at (Run _ Heart Rate, Bike _ Power, Bike _ Heart Rate, etc.) using the dropdown to the right of the duration and time buttons.
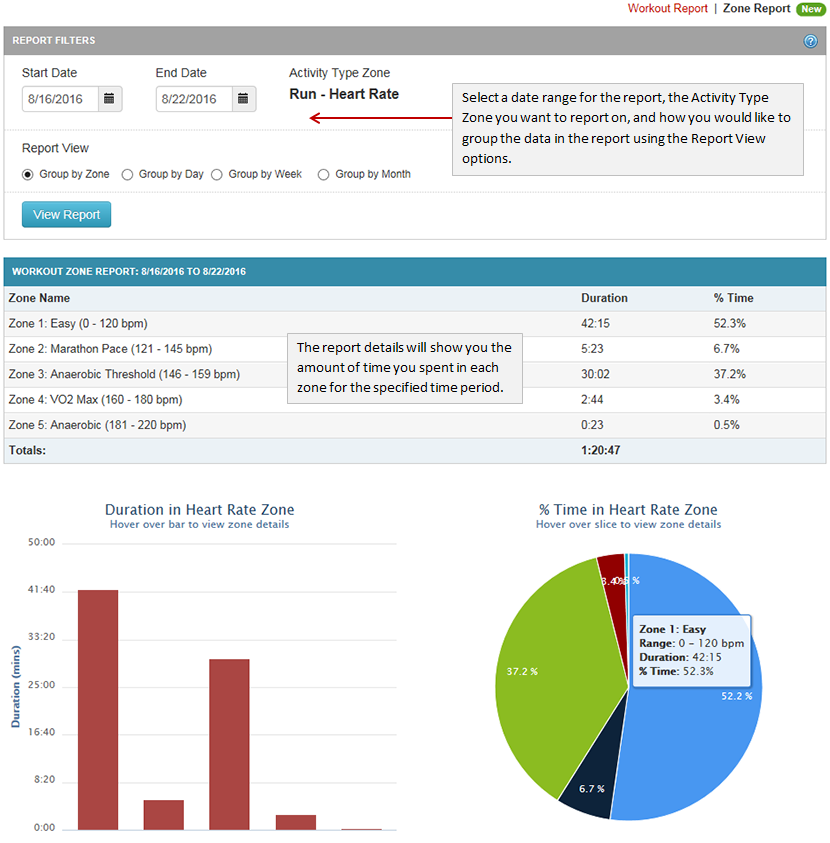
In addition to the new chart on the training log Dashboard, you will now be able to further analyze zone data using our new Zone Report. There are two ways to get to this report. You will now notice a new “Zone Report” button underneath the new chart on the Dashboard. In addition, you can get to this report by clicking on the “Reports & Statistics” icon at the top of the training log and then clicking the new “Zone Report” link at the top right of that page.

Once you are on the Zone Report page, you will see similar options as you do on the Workout Report. The report will default to the last 7 days in the date range fields. Change the date range by simply clicking the calendar icons next to the Start Date and End Date fields. If you have more than one Activity Type Zone set up in the system, you will see a dropdown list of these types. Select the zone type you want to view. If you only have one zone type set up, the report will default to that type and no dropdown list will be shown. Finally, select how you want to group the data using the Report View options. If you group the data by Zone only, you will also see a Duration and % Time in Zone chart along with the data. Click the “View Report” button to run the report for the specified time period.
In addition to the Zone Report page for athletes, coaches will also see a new Zone Report page under the “Workout Report” option in the coaching section. This report will allow you to quickly toggle between athletes in your account and view heart rate and power zone reports.
Team Final Surge


